Category Archives: Learning Guides

Learning Guides, Web Development/UX Design

How to use GatsbyJS to build a blazing fast Drupal website

This is a guest post from Sujit Kumar. If you want to contribute guest posts to code(love), email [email protected].

What is Gatsby?

Gatsby is a static site generator that uses popular technologies such as ReactJS, Javascript and GraphQL in a way that is not dependent on external resources. This makes websites DDOS-resistant, faster, and more secure — and it is really easy to integrate with common content management systems like Drupal.

Why use Gatsby?

  • Unlike dynamic sites which render the pages on demand, static site generators pre-generate all the pages of the website.
  • No more live database querying and no more running through the template engine each time you load a page.
  • Performance goes up and maintenance cost goes down.
  • Using Gatsby means you can host the CMS in-house and publish the content generated by Gatsby as a static website.

It’s always good to increase the performance of Angular and React applications. This is one way you can do it.

GatsbyJS covers all the buzzwords out there like ReactJS, GraphQL, WebPack etc, but the coolest part is that you’re up and running in no time!

Since Gatsby is built on React you straight away get all the things we love about React, like composability, one-way binding, reusability and a great environment.

Gatsby makes Drupal work as a backend which means that we can get a modern stack frontend and complete static site with Drupal as a powerful backend.

Set up Drupal

  • You have to install and configure the JSON API module for Drupal 8.
  • Assuming you already have a Drupal 8 site running, download and install the JSON API module.
  • Composer require drupal/JSON API
    drupal module: install JSON. Or install it manually on Drupal 8 sites.
  • Next, we must ensure that only read permission is granted to anonymous users on the API. To do this, go to the permissions page and check the “Anonymous users” checkbox next to the “Access JSON API resource list” permission. If you skip this step, you’ll get an endless stream of 406 error codes.

After this, you should be all set. Try visiting http://yoursite.com/jsonapi and you should see a list of links.

Install gatsby

Now we need to work on Gatsby. The first thing we need to do is install the Gatsby client. If you don’t have it installed already, run this through NPM to grab it:

npm install --global gatsby-cli

That’ll give you the “Gatsby” cli tool, which you can then use to create a new project, like so:

 gatsby new my-gatsbyjs-app

That command basically just clones the default Gatsby starter repository and then installs its dependencies inside it. Note that you can include another parameter on that command which tells Gatsby that you want to use one of the starter repositories, but to keep things simple we’ll stick with the default. Now if we look at the project we can see a few different directories.

ls -la my-gatsbyjs-app/src/
#> /components
#> /layouts
#> /pages

Pages

The pages directory contains the pages. Each file becomes one page and the name is based on the file name. Each of these files contains a react component.

This is the index.js that we just created.

<script src="https://gist.github.com/nehajmani6/d0509a7b7bf0d8c2e7cf2e4634812155.js"></script>

Layouts

The Layout directory contains a layout that wraps our pages. These layouts are higher order react components that allow defining common layouts and how they should wrap the page. We can place our page where ever we want within the layout using the prop children.

Let’s look at a simple layout component

 <script src="https://gist.github.com/nehajmani6/2e23c6ce6f152dfe5619c4c17394efaf.js"></script>

As you can see, our layout component takes two props.

One is children prop, where the page is wrapped by us.

The second prop is the data. This is actually the data we fetch with the GraphQl query that is at the end of the code snippet – which in this example fetches the title from the gatsby-config. 

Components

The last directory is the components. It is used for creating general components. Fire up the newly generated site.

To run the development mode of the site and to get a Rough idea, run the command:

gatsby develop  
#> DONE Compiled successfully

We’re now up and running! See for yourself at http://localhost:8000

Once complete, you have the basis for a working Gatsby site. But that’s not good enough for us! We need to tell Gatsby about Drupal first.

For this part, we’ll be using the gatsby-source-drupal plugin for Gatsby. First, we need to install it:

cd my-gatsbyjs-app
npm install --save gatsby-source-drupal

Once that’s done, we just need to add a tiny bit of configuration for it, so that Gatsby knows the URL of our Drupal site. To do this, edit the gatsby-config.js file and add this little snippet to the “plugins” section:

plugins:


[
 {
   resolve:`gatsby-source-drupal`,
   options: {
     baseUrl: `http://yoursite.com`, //Drupal site url.
apiBase: `jsonapi`, //This the jsonapi endpoint
   },
 },
]

You’re all set. That’s all the setup that’s needed, and now we’re ready to run Gatsby and have it consume Drupal data.

Run gatsby

Let’s start the development environment to see the Gatsby running.

Run this to get Gatsby running:

gatsby develop

If all goes well, you should see some output with gatsby default starter:

You can now view gatsby-starter-default in the browser.

http://localhost:8000/

View GraphiQL, an in-browser IDE, to explore your site’s data and schema

http://localhost:8000/___graphql

Note that the development build is not optimized.
To create a production build, use gatsby build

(If you see an error message instead, there’s a good chance your Drupal site isn’t set up correctly and is erroring. Try manually running “curl yoursite.com/jsonapi” in that case to see if Drupal is throwing an error when Gatsby tries to query it.)

You can load http://localhost:8000/ but you won’t see anything particularly interesting yet. It’ll just be a default Gatsby starter page. It’s more interesting to visit the GraphQL browser and start querying Drupal data, so let’s do that.

Fetching data from Drupal with graphql

Load up http://localhost:8000/graphql in a browser and you should see a GraphQL UI called GraphiQL (pronounced “graphical”) with cool stuff like auto complete of field names and a schema explorer.

Clear everything that is on the left side and start inserting the open curly bracket and it will auto insert the closing curly bracket. Then click ctrl + space to view the auto-complete, which will list the all possible entity types and bundles that we can query.

It should look something like this:

GatsbyJS

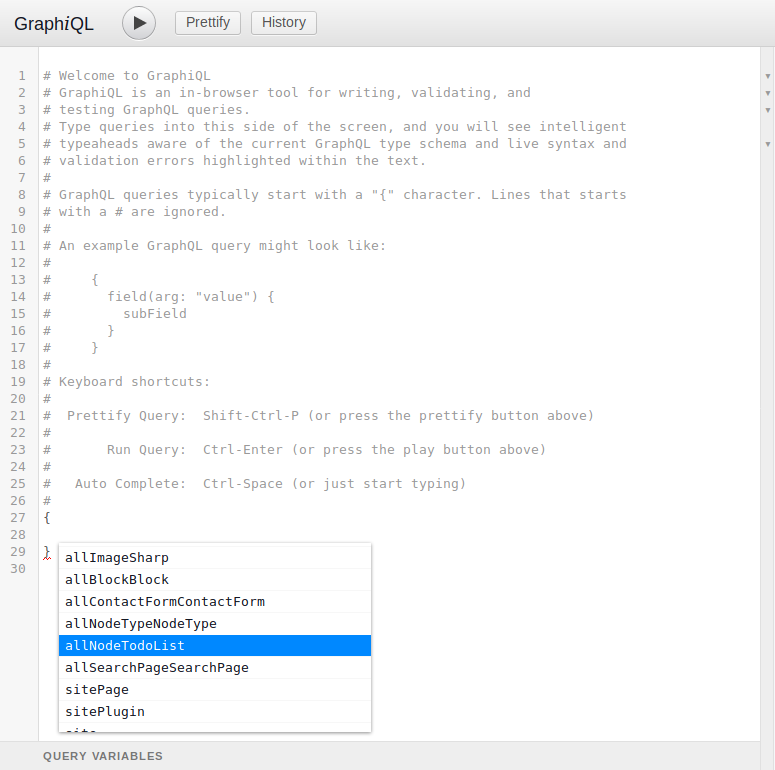
For example, if you want to query Event nodes, you’ll enter “allNodeEvent” there, and drill down into that object.

Here’s an example which grabs the fields (field_task_name, field_date and nid) of the TodoList nodes on your Drupal site:


{
   allNodeTodoList{
       edges{
           node{
               nid
               field_task_name
               field_date
           }
       }
   }
}

Note that “edges” and “node” are concepts from Relay, the GraphQL library that Gatsby uses under the hood. If you think of your data like a graph of dots with connections between them, then the dots in the graph are called “nodes” and the lines connecting them are called “edges.”

Once you have that snippet written, press “control+Enter” to run it, and you should see a result like this on the right side:


{
 "data": {
   "allNodeTodoList": {
     "edges": [
       {
         "node": {
           "nid": 1,
           "field_task_name": "Learn Drupal",
           "field_date": "2018-12-14"
         }
       },
       {
         "node": {
           "nid": 2,
           "field_task_name": "Complete drupal task",
           "field_date": "2018-12-15"
         }
       },
       {
         "node": {
           "nid": 3,
           "field_task_name": "Learn gatsby",
           "field_date": "2018-12-16"
         }
       },
       {
         "node": {
           "nid": 4,
           "field_task_name": "Gatsby Project",
           "field_date": "2019-01-10"
         }
       }
     ]
   }
 }
}

Note the same code will give the data from Drupal which includes the reference data, URIs etc.

Pretty cool right? Everything you need from Drupal, in one GraphQL query.

So now we have Gatsby and Drupal all setup and we know how to grab data from Drupal, but we haven’t actually changed anything on the Gatsby site yet. Let’s change that.

Displaying drupal data on the Gatsby site

The cool thing about Gatsby is that GraphQL is so baked in that it assumes that you’ll be writing GraphQL queries directly into the pages or the components.

In your codebase, check out src/pages/displaynodes.js.

<script src="https://gist.github.com/sourabhsp21/1f69d5cffc5a4bd220b243a2dd8fb3a5.js"></script>

(Note, this assumes you have a node type named “Page”).

All we’re doing here is grabbing the node (task name and task date) via the GraphQL query at the bottom, and then displaying them in a table format.

Here’s how that looks on the frontend:

GatsbyJS

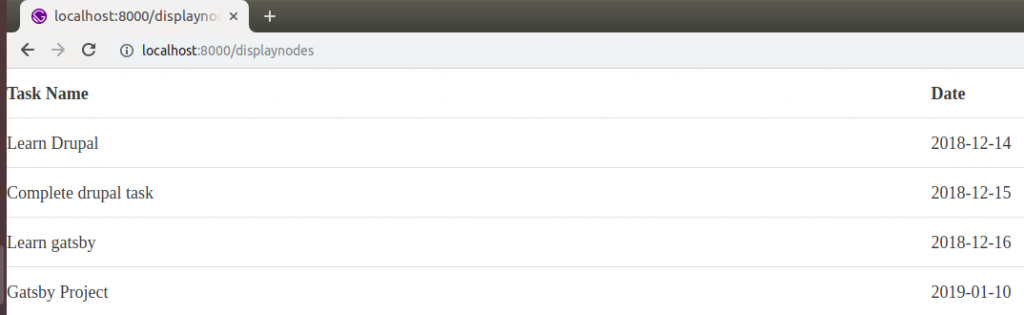
And that’s it! We are displaying Drupal data on our Gatsby site!

Author Bio:

Sujit Kumar is VP of Strategy & Marketing at Valuebound taking care of all aspects of lead generation, company and brand promotion and sales activity. He brings nearly 14+ years of marketing experience, strategic thinking, creativity, and operational effectiveness. Prior to joining Valuebound, Sujit worked in marketing management positions with professional services firms.

Cryptocurrency/Blockchain, Data Science/Artificial Intelligence, Learning Guides, Web Development/UX Design

The Best Programming Language to Learn: a Definitive Guide.

Most people approach me often ask the same question: what’s the best programming language to learn? The answer is: it depends. I wrote an article that declared the mathematical and analytical skills behind programming are what really matter. Now, I’m a bit wiser –so I’ve had the time to break it down into a more tangible and useful answer.

What is the best programming language to learn? It depends, and you can be much more efficient with your time by knowing which programming language is the best for what you want.

So I’ve broken down the best programming language to learn for a variety of needs. I took into consideration the amount of time you need to invest in a programming language and the power you need for different tasks.

You want a versatile, general-purpose language that can be narrowed to different tasks without too much hassle.

The best programming language to learn, source: Pixabay

Python is a programming ecosystem with a vast array of communities and libraries for different use cases. From Django for web development to Pandas for data, Python is the Swiss-army knife of programming languages. Its syntax is also very approachable, and there are tons of tutorials and documentation for beginners. These libraries tend to be almost like learning a new syntax or paradigm.

Still, the ability to import libraries of different kinds and have a relatively consistent experience puts Python up here. If you want a simple intro-level programming language, Python is a great choice. With the second most active community on Github (at about slightly under 15% of all active users), you’re sure to find many projects and usable components to play with in Python.

Python Resources:

Learn Python

This step-by-step tutorial teaches Python in an accessible manner. It makes it easy for you to go through the basics of everything from data structures to how to structure functions. That makes it ideal for people who don’t have programming experience.

11 Beginner Tips for Learning Python

This set of tips is a handy primer for not only learning Python, but really a generalizable way to learn and practice all kinds of different programming languages.

Zen of Python

The Zen of Python is more philosophical than practical. Still, it serves as a useful reminder of the ideals of Python programming and the ideals one should strive for. Simple, after all, is better than complex.

Codecademy: Learn Python for Free

This free interactive Codecademy course is a great way to start with Python basics and syntax. Use it to cement the theory you’ve learned and start practicing with Python.

Web Development Using Python and Django

Python is versatile mostly because there are tons of documentation and frameworks. Django is a content management system built on Python. This curated curriculum will help you learn what you need to build fully-fledged websites with Python by tapping into Django.

You’re interested in working with data, in a data analysis or data science capacity or as a data engineer/machine learning engineer

The best programming language to learn, source: Pixabay

When it comes to the data ecosystem, you’ll want to learn SQL as a domain-specific way to work with data. However, SQL is not a general purpose programming language, but merely a utility to deal with one data type over another. You can think of it as a complex interface to the .sql data format.

There are two obvious choices here, R or Python. Academics tend to use R. It used to have the bulk of good data visualization and analytics libraries. Now, however, the open-source Python community has sprinted to catch up. With the advent of machine learning, the balance has shifted towards Python.

Previously, I wrote about both R vs. Python a few years ago. I came out with the conclusion that both had their uses. It was perhaps best to learn both. Practically speaking however, if you’re dealing with large amounts of data ,Python gets the slightest of edges here as the best programming language to learn for data purposes, especially if you’re coming from a programming background in the first place — it’ll be easier for you to work with Python’s syntax than R.

Python and Data Resources:

Data Science Sexiness, R vs Python

I wrote this guide describing the differences between R and Python, and listed a bunch of learning resources for both. I concluded it might be best to learn both, but I’ve since become immersed in the Python ecosystem when it comes to data.

Introduction to the Machine Learning Stack

I wrote this tutorial which summarized the frameworks and libraries you need to know to get started doing machine learning with different frameworks, most of which have Python ports or APIs so you can write code in Python (or in any case, Pythonic syntax) and get started.

Pandas Cookbook

Pandas was where I really started practicing programming: wrangling datasets is a passion of mine. This tutorial walks through how to use Pandas with an example dataset. You’ll learn how to import data of different formats, transform it in different ways, and then extract and export it.

How to do Common Excel and SQL Tasks in Python

Another tutorial I wrote helps you port some of the logic and functions in both Excel and SQL to Python. Do everything from importing data to analyzing it in the summary form or filtered form you’ve come to expect.

Machine Learning in Python

This curated curriculum takes your Python skills and helps you learn machine learning theory. By pairing the two, you can start working on machine learning projects by the end.

You want to build mobile applications that require access to native functionalities such as a phone camera

The best programming language to learn, source: Pixabay

Depending on what ecosystem you want to build in, the best language is quite selective. If it’s the Android ecosystem, you’re going to have to learn Java.

Meanwhile, if you’re interested in building for the iOS ecosystem and getting placed on Apple’s App Store, you’ll have to learn Swift. Swift is Apple’s official programming language for its laptops based on MacOS, iOS, or for Apple Watch apps.

There are other ecosystems such as Microsoft, which needs C#. There are also cross-platform programming languages such as React Native. Microsoft doesn’t have as much market share as either Android phones or iPhones. Reach Native doesn’t have access to as many of the specific native functions on either device (and you’ll have to compile down to Swift or Java to get those features). Still, they’re handy languages to know about, even if they might not be the best — unless you were trying to launch on as many platforms as possible.

Resources:

Android Application Development

Learn the ins and outs of Android application development, from building an application to how debug common issues.

Introduction to Swift

This interactive set of courses will help you get through the basics of Swift and building iOS applications. You’ll pass to an intermediate stage/course once done.

400+ Swift Language Video Tutorials

If video learning is more of your thing, look no further than this series of video tutorials on Swift topics. They’re broken down into sets of continuous playlists, so you can pick and choose a particular curated playlist or choose a particular topic to focus on.

React Native Tutorial

This React Native tutorial and documentation from Facebook is a fairly comprehensive overlook on how the versatile cross-platform framework works.

Expo

If you want to speed up your app development cycle across multiple platforms and want to stick to using JavaScript for your mobile app coding, Expo can be a quick, iterable solution.

You want to build the latest web applications

The best programming language to learn, source: Pixabay

For web development, PHP used to be the default, powering everything from e-commerce sites to WordPress itself. Now though, most people have shifted to JavaScript and different frameworks within it. There’s a bit of a fight going on between the major tech companies on building web development interfaces, with Google sponsoring Angular.js while Facebook builds React.js. In practice, these mega-corporations are building the most recent web development frameworks for their needs and then open-sourcing and supporting the developments.

Both are doing it on JavaScript, so if you want to build the latest and greatest in web applications and benefitting from their work and others, look no further. JavaScript is the best programming language to learn for cutting-edge web development applications. It boasts the most active community on Github with over 22% of all active users participating in the JavaScript community.

JavaScript Resources:

An Introduction to JavaScript

This wiki gives you a broad overview of JavaScript and how it serves web content. You’ll understand basic concepts like how JavaScript interacts with browsers once you’re done. You can then take the next step towards learning more powerful frameworks.

jQuery Intro

jQuery is a powerful JavaScript library that allows you to do powerful things such as animations with a one-word function. Use this tutorial to grasp the basics and combine it with HTML and CSS to serve dynamic web content easily.

How to Learn React — A roadmap from beginner to advanced

This roadmap will help you conceptualize your roadmap for learning JavaScript frameworks like React.js.

React.js, Codecademy

React.js is a powerful framework to create web interfaces. Practice with this Codecademy course.

MEAN Stack Tutorial

This tutorial will summarize all of your theory-based learning towards building a MEAN stack application that will serve as a Reddit clone. This is a full-featured web app that has user authentication, databases through MongoDB, routing and linking through Express and a back-end server through Node.js and a combination of Angular (though React can also be used in this situation). At the end of this tutorial, you should be able to extend your learnings and build full-fledged web apps.

You need to do something that requires very high performance (ex: cryptography)

The best programming language to learn, source: Pixabay

For tasks that require a lot of compute power and manipulation of lower-level processes such as dynamic memory allocation, it’s best to work in C++. Lower-level tasks require more efficient implementations of memory and space and involve working closer to hardware in order to get higher performance. C++ is lower-level than all of the languages discussed about yet is also still readable and compilable enough so that with some practice, you can be conversant in it.

Python can access lower-level functions with something called Cython using the C programming language. Bitcoin is coded in C++, including its advanced cryptographic features. In order to do something at a highly performant level, you’ll likely need to access C++ and its superior lower-level flexibility.

C++ Resources:

Introduction to C++

This edX course, provided by Microsoft, will help you get started with C++ and its basics.

C++ Language

This wiki helps you tackle C++ from A to Z. There’s different sections dedicated to everything from how to write functions in the language to how to deal with different variables and types.

C++ Codecademy

Consolidate all of the theory you’ve learned by practicing with this free C++ course with Codecademy.

Cython Tutorial

Cython allows you to access C++ functions while using Python, combining the versatility of the Python ecosystem with the power of C++.

C++ Cryptography Libraries

If you want to look into advanced functions such as cryptography, look through this list of C++ cryptography libraries to get you started.

—–

I hope this tutorial has helped you determine what the best programming language to learn for you. If you have any questions, feel free to ask me at [email protected]. Please leave a comment below if you want to give feedback or if you think I’m missing something 🙂

Learning Guides, Quantum Computing

A Comprehensive Introduction to Quantum Computing

If you’ve heard about quantum computers, you might get the itch to start working on something in the field. What is quantum computing? How do you get started?

Full disclosure: I’m not an expert in the field. I’m just a regular (self-taught) coder. I compiled this tutorial because I was interested in exploring quantum computing. The goal was to define the use cases that made it stand out from classical computing. I also didn’t want to dive too deep into the quantum physics part. Many of the explanations below will be basic, and assume that you have little context in quantum computing.

Also, if this is inartfully explained, or flagrantly wrong, I welcome feedback and will make corrections. And if this is helpful, I appreciate knowing as well 🙂

Introduction to Quantum Computing

Unlike classical computing, quantum computing uses quantum phenomena that intersect with mechanical properties, such as superposition and entanglement. Binary code stores data in either a definite 0 or definite 1 state. Quantum computing uses qubits: bits of data that can coherently rest in a combination of 0 or 1 state probabilities. A qubit can theoretically hold more data than a classical bit. Unfortunately, it is impractical to store a large amount of information in a qubit due to how measurement disturbs a quantum system. To get any further, we have to define three concepts.

Quantum superposition: Quantum superposition allows quantum bits (qubits) to coherently hold together many states of data until the data is decomposed. A piece of data can coherently be in two states before it is measured as one. The most well-known example of this is Schrödinger’s cat. A which posits that a cat might be simultaneously alive or dead in a sealed box based on the probability that a poison might be leaked inside. Only once the observer lifts the sealed box is the final state of the cat revealed. Quantum superposition works metaphorically the same way.

Quantum superposition is what allows quantum computing to be extraordinary. The ability to superimpose extraordinary amounts of data allows for much faster calculations than can be done in classical computing. Mathematically speaking, quantum superposition allow qubits to be linear combinations of different quantum states rather than fixed, mutually exclusive categories. This is what allows for a qubit to store more classical information than the strictly binary classical bit.

Quantum entanglement: Entanglement refers to the correlation between different quantum-level molecules. If one entangled molecule has a clockwise spin, another entangled one might have a counter-clockwise spin, no matter the distance between them. This happens with large molecules and even some small diamonds.

Entanglement means you have to read a whole system of data rather than individual data points. The “information” contained in entangled quantum data includes how the entire system is structured. You cannot isolate information from individual molecules or parts.

This is the beginning of the constraint of quantum computing. Quantum states can capture more data, but you have to capture the entire entangled system to do something useful with it. Recent scientific advances in maintaining the lifetime of quantum entanglement have helped push quantum computing further.

Quantum decoherence: Decoherence is the bogey-man of quantum computing. Whenever quantum states are exposed to an observer they start decomposing, meaning information gets lost as time goes on. Quantum decoherence is a major bottleneck to quantum computing at scale.

TLDR (too long didn’t read): Quantum computers are amazing because they can collapse a lot of data into quantum states rather than just the old “0,1” of physical binary code. You can make simultaneous calculations orders of magnitude above what you can do with your regular computer.

Yet, you have to deal with the messy problem of entangled quantum molecules. You have to read the state of the whole system rather than its individual components. And you have to do all that before the state of the system loses coherence with the passage of time.

quantum computing
The even more TLDR version

Quantum Use Cases

What can that extraordinary quantum computational power allow you to do beyond classical computing if you’re able to capture the data in a coherent manner? Here are some examples.

Quantum annealers

Perhaps the most well-known example of quantum computing is D-Wave. One common misconception is that D-Wave is building full quantum computers. They’re really building quantum annealers. What’s the difference? In summary, you can use a quantum annealer to find a local “good enough” minimum much faster than a classical computing context, making quantum annealers ideal for factoring numbers and network analysis/optimization. Complex machine learning models can run on a quantum annealer in much less time if you don’t care as much about finding the absolute best answer. Yet, quantum annealers are not set up to run full quantum algorithms.

Boeing uses quantum annealers to facilitate plane research, and healthcare providers use them to calculate the optimal radiology treatment with cancer patients.

Yet, you won’t be able to run Shor’s algorithm on a D-Wave quantum annealer or any full quantum algorithm, and so you wouldn’t be able to use D-Wave to fully crack cryptography patterns (except on a limited basis). That requires a universal gate quantum computer, a different beast than a quantum annealer.

Shor’s algorithm

There is a comprehensive catalog of about 50 quantum algorithms. Among the most interesting of those would be Shor’s algorithm which can solve for the prime factors of very large and complex numbers. When people talk about securing devices, blockchains and more for a “post-Quantum” world, they are talking about a world where a quantum computing device is able to calculate Shor’s algorithm and break certain parts of modern cryptography .

Grover’s algorithm

Grover’s algorithm helps reverse functions: usually, given X input you find Y output, but here, with a given Y output you can find the X input that initiated it. This is useful for database search. You can search to find a given X and whether it is present in a certain set of data. It could also be used to reverse-engineer user credentials. This might allow attackers to create counterfeit blocks on a blockchain or steal user passwords.

Quantum algorithms in general

Algorithms that are better processed in quantum settings than in classical computing are plenty: there are about 50 examples, ranging from verifying matrix products to Pell’s equation, with polynomial to superpolynomial (exponential) speedup over their classical variants — though whether those speedups are still present after rigorous testing is still an academic matter.

Quantum programming frameworks

Now that you’ve run through some of the theory, what programming frameworks are out there to implement quantum computing concepts?

Qiskit

Qiskit is an open-source quantum computing platform developed in collaboration with IBM’s Q platform. You can run it on quantum computers built by IBM. This allows educators, researchers and businessmen a first look at the possibilities of quantum computing without having one themselves.

Resource:  Qiskit-tutorials, available on Github, is a series of Jupyter notebooks that go into the basics of programming with Qiskit. They are community notebooks that serve as both interactive tutorial and a wiki of sorts on quantum computing in general.

Q#

Called “Q Sharp”, this is Microsoft’s effort to join the quantum computing fray. Most Q# subroutines will run on a simulator instead of an actual quantum chip. Microsoft’s Visual Basic Studio supports Q#. As Microsoft offers more quantum products, it will become the de facto language of the Microsoft quantum computing ecosystem.

Resource: With this quickstart tutorial, Microsoft gets you up to speed with how to use Q#.

QCL

QCL is a high-level programming framework for quantum computing that abstracts away some of the physics associated with quantum phenomenon.

Resource: This simple primer offers an explanation for the roots of QCL and its similarity to existing traditional computer science languages, with a few specific differences (such as the dump function which returns the current quantum state of all qubits) that make it suited to quantum computing, but comfortable enough for traditional computer scientists.

Project Q

Project Q is an open-source programming framework for quantum computing developed at ETH Zurich. It features a high-level programming language for quantum programming, the ability to customize the compiler, and specific libraries to solve for quantum problems. You can run Project Q on quantum simulators or run it on IBM’s 5-qubit quantum computer.

Resource: This Github repo filled with examples from Project Q code serves as a useful reference and tutorial to explore.

Cirq

Cirq is Google’s effort to address a chronic problem with limited-qubit quantum computers (namely error-correction). It’s a Python library you can install via pip (pip install cirq). It’s a useful tool that you can access right away if you’re running a Python environment.

Resource: Use this step-by-step tutorial on using Cirq on Medium to understand its capabilities.

D-Wave Leap

D-Wave Leap offers an interactive cloud platform where you can operate on D-Wave annealers online. You can work in Python and Jupyter notebooks and have immediate access to a D-Wave 2000Q quantum computer. You get a minute of free QPU time which you can use to solve between 400 and 4000 problems.

Resource: This link allows you access to a set of Jupyter notebooks where you can try D-Wave Leap.

Quantum Computing Careers

What are the career prospects of working with quantum computing? For now, the field is mostly academic in nature — and there are few commercial use cases. A search on Indeed.com returns no results for quantum computer or quantum programmer. There are some research roles/internships such as the following from Microsoft. With IBM, Microsoft and Google making big bets in the space however, more quantum careers are surely coming.

quantum computing

Quantum Computing Resources

If you want to follow the space, here are a few great communities and resources to keep track of.

Quantum Bits

This Medium publication hasn’t been updated recently, but it features many interesting articles on quantum computing concepts. Anastasia Marchenkova, a quantum physicist whose passion is quantum computing, writes most of the content.

Microsoft Quantum Computing Newsletter

Microsoft offers a newsletter dedicated around the latest quantum computing updates as well as industry news. While it’s focused on selling Microsoft products, you can gain valuable insights here.

Quanta Magazine (Quantum Computing Section)

Quanta Magazine takes a different approach from the rest of the resources in this space, focused on quality storytelling. It acts as a compelling story-driven overview into advances in quantum computing and the people who make them.

Stack Exchange (Quantum Computing)

The Stack Exchange for Quantum Computing offers deeper answers on quantum computing theory and quantum programming frameworks.

Reddit Quantum Computing

Check out this subreddit for the latest trending quantum computing discussions and articles. With over 10,000 subscribers, it is one of the largest communities dedicated to quantum computing.

Quantum Computing Courses

Quantum Learning Algorithms (Coursera)

Coursera offers this course from Saint Petersburg State University. It covers quantum algorithms, including the two most common discussed (Shor’s algorithm, and Grover’s Algorithm).

Quantum Machine Learning (edX)

This free course offered by University of Toronto (it offers a verified certificate for $49 USD) will go over the use cases of quantum computing in machine learning, and where machine learning can benefit from quantum computing advantages.

Quantum Computing for the Determined

This free video series from Michael Nielsen goes over the theory of qubits in detail, allowing you to get an introductory view to quantum computing theory. Buckle up, finish the whole series, and you’ll be capable of tackling basic implementation of that theory.

Quantum Computation (MIT Open Courseware)

This free course on MIT’s open platform teaches the theory behind quantum computation. Professor Peter Shor , who was the inventor of Shor’s Algorithm, teaches it.

Quantum Computing: Lecture Notes

These set of notes about quantum computing by Ronald de Wolf (a full-time professor at the University of Amsterdam) serve as a text-heavy and notation-heavy deep dive into quantum computing topics. Regard it as a textbook for whenever you need a deep dive on a particular subject.


I hope you enjoyed this introduction — I’d love feedback on what specific topics and resources I can build in the space. Comment below if you have any ideas!

Data Science/Artificial Intelligence, Learning Guides

Learn machine learning with Python: a free curated curriculum

How to learn data science and deep learning in Python

I recently wrote a 80-page guide to how to get a programming job without a degree, curated from my experience helping students do just that at Springboard. This excerpt is a part where I focus on how to learn machine learning in Python.

How to learn machine learning in Python is a very popular topic: with the rise of artificial intelligence, programmers have been able to do everything from beating human masters at Go to replicating human-like speech. At the foundation of this fantastic technological advance are programming and statistics principles you can learn.

Here’s how to learn machine learning in Python:

Sponsored link: 

Excel can be a powerful tool for data exploration and analysis when dealing with small data sets, but for anything more complex it often makes more sense to use Python. PyXLL lets you keep the best of both by integrating Python into Excel. You can use Excel as an interactive user interface and use Python to do the data fetching, cleaning and computation.

Python Basics

learn machine learning

Before you learn how to run, you have to learn how to walk. Most people who start learning machine learning and deep learning come from a programming background: if you do, you can skip this section. However, if you’re new to programming or you’re new to Python, you’ll want to take a look through this section.

Codecademy for Python

Codecademy is an online platform for learning programming, with free interactive courses that encourage you to fully type out your code to solve simple programming problems.

Introduction to Python for Data Science

This interactive Python tutorial is created by Datacamp, and is more suited to introducing how Python basics work in the context of data science.

11 Great Resources to Learn and Work in Python

This list of resources will point you to great ways to immerse yourself in Python learning. It’s a broad list filled with different resources that will help you, no matter your learning style.

Installing Jupyter Notebook

These are instructions for installing Jupyter Notebook, an intuitive interface for Python code. You’ll have all of the important Python libraries you need pre-installed and you’ll be easily able to export out and show all of your work in an easy-to-visualize fashion. I strongly suggest that you use Jupyter as your default tool for Python, and the rest of this learning path assumes that you are.

Statistics Basics

learn machine learning

In order to learn machine learning in Python, you not only have to learn the programming behind it — you’ll also have to learn statistics. Here are some resources that can help you gain that fundamental knowledge.

Khan Academy, Math, and Statistics

Khan Academy is the largest source of free online education with an array of free video and online courses. This section on Khan Academy will teach you the basic statistics concepts you need to know to understand machine learning, deep learning and more — from mode, median, mean to probability concepts.

Probabilistic Programming & Bayesian Methods for Hackers

This book will delve into Bayesian methods and how to program with probabilities. Combined with your budding knowledge of Python, you’ll be quickly able to reason with different statistical concepts. It’s a book the author gave out for free — and its deeply interactive nature promises to engage you into these new concepts.

Pandas

learn machine learning

The main workhorse of data science in Python is the Pandas data science library, an open-source tool that allows for a tabular organization of large datasets and which contains a whole array of functions and tools that can help you with both data organization, manipulation, and visualization. In this section, you’ll be given the resources needed to learn Pandas which will help you to learn machine learning in Python.

Cooking with Pandas

Julia Evans, a programmer based in Montreal, has created this simple step-by-step tutorial on how to analyze data in Pandas using noise complaint and bike data. It starts with how to read CSV data into Pandas and goes through how to group data, clean it, and how to parse data.

Official Pandas Cookbook

The official Pandas cookbook involves a number of simple functions that can help you with different datasets and hypothetical transformations you might want to do on your data. Take a look and play with it to extend your knowledge of Pandas.

Data Exploration and Wrangling

learn machine learning

Before you can do anything with the data, you’ll want to explore it, and do what is called exploratory data analysis (EDA) — summarize your dataset and get different insights from it so you know where to dig deeper. Fortunately, tools like Pandas are built to give you relevant and surprisingly deep summary insights into your data, allowing you to shape which questions you want to explore next.

By looking through your dataset from afar, you’ll already be able to understand what faults the dataset might have that will keep you from completing your analysis: missing values, wrongly formatted data etc. This is where you can start processing and transforming the data into a form that you want to answer your questions. This is called “data wrangling” — you are cleaning the data and making sure that it is able to answer all of your questions in this step.

Python Exploratory Data Analysis with Pandas

This article from Datacamp goes through all of the nuts and bolts functions you need in order to take a slightly deeper look at your data. It covers topics ranging from summarization of data to understanding how to select certain rows of data. It also goes into basic data wrangling steps such as filling in null values. There are interactive embedded code workspaces so you can play with the code in the article while you are digesting its concepts.

A Comprehensive Introduction to Data Wrangling

This blog article from Springboard is filled with code examples that describe how you can filter data, detect and drop invalid/null values from your dataset, how to group data such that you can perform aggregated analyses on different groups of data (ex: doing an analysis of survival rate on the Titanic by gender or passenger class) and how to handle time series data in Python. Finally, you’ll learn how to export out all of your work in Python so that you and others can play around with it in different file formats such as the Excel-friendly CSV.

Pandas Cheat Sheet

This Pandas cheat sheet, hosted on Github, can be an easy, visual way to remember the Pandas functions most essential to data exploration and wrangling. Keep it as a handy reference as you go out and practice some more.

Data Visualization

learn machine learning

Data exploration and data visualization work together hand-in-hand. Learning how to visualize data in different plots can be important is seeing underlying trends.

Beginner’s Guide to Matplotlib

This legend of resources on the official matplotlib library (the workhorse library for Python data visualization) will help you understand the theory behind data visualization and how to build basic plots from your data.

Seaborn Python Tutorial

The Seaborn library allows people to create intuitive plots that the standard matplotlib library doesn’t cover easily: things like violin plots and box plots. Seaborn comes with very compelling graphics right out of the box.

Introduction to Machine Learning

learn machine learning

Machine learning is a set of programming techniques that allow computers to do work that can simulate or augment human cognition without the need to have all parameters or logic explicitly defined.

The following section will delve into how to use machine learning models to create powerful models that can help you do everything from translating human speech to machine code, to beating human grandmasters at complex games such as Go.

It’s important before we get started implementing ideas in code that you understand the fundamentals of machine learning. This section will help you understand how to test your machine learning models, and what statistics you should use to measure your performance. It is an essential cornerstone to your drive to learn machine learning in Python. 

A Visual Introduction to Machine Learning

This handy visualization will allow you to understand what machine learning is and the basic mechanisms behind it through a visual display of how machines can classify whether a home is in New York or in San Francisco.

Train/Test Split and Cross-Validation in Python

This article explains why you need to split your dataset into training and test sets and why you need to perform cross-validation in order to avoid either underfitting or overfitting your data. Does that seem like a lot of jargon to you? The article will define all of these different concepts, and show you how to implement them in code.

Sci-kit Learn

learn machine learning

Sci-kit learn is the workhorse of machine learning and deep learning in Python, a library that contains standard functions that help you map machine learning algorithms to datasets.

It also has a bunch of functions that will allow you to easily transform your data and split it into training and test sets — a critical part of machine learning. Finally, the library has many tools that can evaluate the performance of your machine learning models and allow you to choose the best for your data.

You’ll want to make sure you know how to effectively use the library if you want to learn machine learning in Python.

A Gentle Introduction to Scikit-Learn

This post introduces a lot of the history and context of the Sci-Kit Learn library and it gives you a list of resources and documentation you can pursue to further your learning and practice with this library.

Scikit-Learn Documentation

The official scikit-learn documentation is filled with resources and quick start guides that will help you get started with Scikit-Learn and which will help you entrench your learning.

Regression

learn machine learning

Regression involves a breakdown of how much movement in a trend can be explained by certain variables. You can think about it as plotting a Y or dependent variable versus a slew of X or explanatory variables and determining how much of the movement in Y is dependent on individuals factors of X, and how much is due to statistical noise.

There are two main types of regression that we’re going to talk about here: linear regression and logistic regression.  Linear regression measures the amount of variability in a dependent factor based on an explanatory factor: you might, for example, find out that poverty levels explain 40% of the variability in the crime rate. Logistic regression mathematically transforms a level of variability into a binary outcome. In that way, you might classify if a name is most likely to be either male or female. Instead of percentages, logistic regression produces categories.

You’ll want to study both types of regression so you can get the results you need.

Simple and Multiple Linear Regression in Python

This informative Medium piece goes into the theory and statistics behind linear regression, and then describes how to implement it in Sci-Kit Learn.

Building a Logistic Regression in Python, Step-by-Step

This Medium tutorial uses the Sci-Kit Learn tools available to implement a logistic regression model. The amount of detail in each step will help you follow along.

Clustering

learn machine learning

Another type of machine learning model is called clustering. This is where datasets are grouped into different categories of data points based on the proximity between one point and other groups of points. Mastering clustering is an important part of learning machine learning in Python. 

An Introduction to Clustering and different methods of clustering

Analytics Vidhya has presented this comprehensive introduction to clustering methods: it’s good to get a handle on this theory before you try implementing it in code.

Customer Segmentation using Python

This article from Yhat demonstrates how to do simple K-means clustering across different wine customers. It’ll take your learning in Pandas and Scikit-Learn and combine them into a useful clustering example.

Deep Learning/Neural Networks

learn machine learning

Neural networks are an attempt to simulate how the human mind works (on a very simplified level) in computational code. They have been a great advance in artificial intelligence — and while in some ways they are a black box of complex algorithms working in tandem to learn how data generalizes, their practical applications have exponentially multiplied in the last few years. Deep learning encompasses neural networks as well as other approaches meant to simulate human intelligence. They are an important part to learn if you want to learn machine learning in Python. 

In a huge breakthrough, Google’s AI beats a top player at the game of Go

This short Wired article isn’t a technical tutorial: it’s the recounting of an epic match between a human grandmaster at Go, a game that was supposed to be so complex for computers to win that technology to do so wasn’t supposed to come until around the 2030s. By leveraging the power of neural networks, Google was able to bring AI victory forward some two decades or so. This article should give you a great glimpse at the potential and power of neural networks.

A Beginner’s Guide to Neural Networks in Python and SciKit Learn 0.18

This example-laden tutorial uses the neural networks module in the Scikit-Learn library to build a simple neural network that can classify different types of wine. Follow along and play with the code so you can get a feel for how to build neural networks.

Develop Your First Neural Network in Python With Keras Step-By-Step

This tutorial from Machine Learning Mastery uses the Python implementation of the Keras library to build slightly more powerful and intricate neural networks. Keras is a code library built to optimize for speed when it came to experimenting with different deep learning models.

Big Data

learn machine learning

Big data involves a lot of volume and velocity of data. It’s an amount of data, measured in petabytes, that can’t be processed easily with tools like Pandas, which are based on the processing power of one laptop or computer.

You’ll want to scale out to controlling many processors and servers and passing data through a network to process data at scale. Tools that allow you to map and reduce data between multiple servers and others such as Spark and Hadoop play an important role here. It’s time to take the learning you’ve had before this and apply it to massive data sets! You can’t learn machine learning in Python without dealing with big data. 

Get Started With Pyspark and Jupyter Notebook in 3 Minutes

This blog post will help you get set up with PySpark, a Python library that brings the full power of Spark to you in the Jupyter Notebook format you’ve been used to working in. PySpark can be used to process large datasets that can go all the way to petabytes of data!

PySpark Video Tutorial

This video tutorial will help you get more context about PySpark and will provide sample code for tasks such as doing word counts over a large collection of documents.

Using Jupyter on Apache Spark: Step-by-Step with a Terabyte of Reddit Data

This tutorial from Insight goes a little further than installation instructions and gets you working with Spark on a terabyte (that’s 1024 gigabytes!) of Reddit comment data.

Machine Learning Evaluation

learn machine learning

Now that you’ve learned a baseline for all of the theory and code you need to learn machine learning in practice, it’s time to learn what metrics and approaches you can use to evaluate your machine learning models.  

Metrics to Evaluate Machine Learning Algorithms in Python

In this tutorial, you’ll learn about the different metrics used to evaluate the performance of different machine learning approaches. You’ll be able to implement them in Scikit-Learn and Jupyter right away!

Model evaluation, model selection, and algorithm selection in machine learning

This long six-part series (check the end of this blog post for more posts after) goes deep into the theory and math behind machine learning evaluation metrics. You’ll come out of the whole thing with a deeper knowledge of how to measure machine learning models and compare them against one another.

Suggested daily routine

Learning isn’t often a static thing. You need ongoing practice to master a skill. Here’s a suggested learning routine you can implement in your day to make sure you practice and expand your knowledge and learn machine learning in Python.

Here’s my suggested daily routine:

  1. Continue working on something in machine learning at all times
  2. Go to StackOverflow, ask and answer questions
  3. Read the latest machine learning papers, try to understand them
  4. Practice your code whenever you can by looking through Github machine learning repositories
  5. Do Kaggle competitions so you can extend your learning and practice new machine learning concepts

At the end, you’ll have effectively mastered how to learn machine learning in Python!

Want more material like this? Check out my guide on how to get a programming job without a degree.

Data Science/Artificial Intelligence, Learning Guides

How to do common Excel and SQL tasks in Python

How to do common Excel and SQL tasks in Python

The code and data for this tutorial can be found in this Github repository. For more information on how to use Github, check out this guide

Data practitioners have many tools that they use to slice and dice data. Some people use Excel, some people use SQL — and some people use Python. The advantages of using Python are obvious when it comes to certain tasks. You can process much bigger datasets at much faster speeds. You can use open source machine learning libraries built on top of Python. You can easily import and export data in different formats. 

Python can become an essential part of any data analyst’s toolbox due to its versatility. However, it can be hard to get started. Most data analysts are probably familiar with either SQL or Excel. This tutorial is structured to help you transfer over skills and techniques from those two programs to Python.

First, let’s get you set up on Python. The easiest way to get started is to use Jupyter Notebook and Anaconda. This visual interface will allow you to plug Python code in and immediately see the output of your results. It’ll make it easy for you to follow along with the rest of this tutorial as well.

I highly recommend using Anaconda, but this beginners guide will also help you with installing Python directly — though that’ll make following this tutorial harder. 

Let’s start with the basics: opening up a dataset.

IMPORTING DATA

You can import .sql databases and process them in SQL queries. On Excel, you could double-click a file and then start working with it in spreadsheet mode. In Python, there’s slightly more complexity that comes at the benefit of being able to work with many different types of file formats and data sources.

Using Pandas, a data processing library, you can import a variety of file formats using the read function. A full list of the file formats you can import using this function is in the Pandas documentation. You can import everything from CSV and Excel files to the whole content of HTML files!

One of the biggest advantages of using Python is the ability to be able to source data from the vast confines of the web instead of only being able to access files you’ve downloaded manually. The Python requests library can help you sort through different websites and take data from them while the BeautifulSoup library can help you process and filter the data so you get exactly what you need. Be careful of usage rights issues if you’re going to go down this route.

(Don’t worry if you want to skip this part, you can! The raw csv file is here, and you can download it at will if you’d rather start this exercise without taking data from the web. Or you can git clone the entire repository.)

In this example, we’re going to take a Wikipedia table of countries by their nominal GDP per capita (a technical term that means an amount of income a country earns divided over the number of its population), and use the Pandas library in Python to sort through the data.

First, let’s import the different libraries we need. For more information on how imports work in Python, click here.

import pandas as pd
import numpy as np
import requests
from bs4 import BeautifulSoup
import re

We’ll need the Pandas library to process our data. We’ll need the numpy library to perform manipulations and transformations of numeric data. We’ll need the requests library to get HTML data from a website. We’ll need BeautifulSoup to process that data. Finally, we’ll need the regular expression library of Python (re) to change certain strings that will come up as we process the data. 

It’s not necessary to know much about regular expressions in Python, but they are a powerful tool you can use to match and replace certain strings or substrings. Here’s a tutorial if you wanted to learn more.

r = requests.get('https://en.wikipedia.org/wiki/List_of_countries_by_GDP_(nominal)_per_capita')

gdptable = r.text
soup = BeautifulSoup(gdptable, 'lxml')
table = soup.find('table', attrs = {"class" :"wikitable sortable"})

theads=[]
for tx in table.findAll('th'):
    theads.append(tx.text)

data =[]
for rows in table.findAll('tr'):
        row={}
        i=0
        for cell in rows.findAll('td'):
            row[theads[i]]=re.sub('\xa0', '',cell.text)
            i+=1
        if len(row)!=0:
            data.append(row)
print(data)

Credit to this website for some of the code.

Here’s a more technical explanation of how to grab HTML tables with Python code with more step-by-step instructions.

You can copy + paste the code above into your own Anaconda setup, and iterate with it if you want to play with some Python code!

The output from the code below, if you don’t modify it, is what is known as a list of dictionaries.

You’ll notice commas separating bracketed lists of key-value pairs. Each bracketed list represents a row in our dataframe, and each column is represented by the keys within: we are working with a country’s rank, its GDP per capita (expressed as US$), and its name (in ‘Country’).

For some more information on how data structures such as lists and dictionaries work in Python, this tutorial will help as well as this course: Intermediate Data Science Course by Springboard.

Thankfully, we don’t need to understand much of that in order to move this data into a Pandas dataframe, a similar way of aggregating data to a SQL table or an Excel spreadsheet. With one line of code, we’ve assigned and saved this data into a Pandas dataframe — as it turns out to be the case, lists of dictionaries are the perfect data format to be converted to a dataframe.

gdp = pd.DataFrame(data)

With this simple Python assignment to the variable gdp, we now have a dataframe we can open up and explore anytime we write out the word gdp. We can add Python functions to that word to create curated views of the data within. For a bit more of an in-depth look at what we just did with the equal sign and assignment in Python, this tutorial is helpful.

TAKING A QUICK LOOK AT THE DATA

Now, if we want to take a quick look at what we’ve done, we can use the head() function, which works very similarly to selecting a few rows in Excel or the LIMIT function in SQL. Use it handily to take a quick look at datasets without loading the whole thing! You can also insert a number within the head function if you want to look at a particular number of rows.

gdp.head()

The output we get are the first five rows of the GDP per capita dataset (the default value of the head function), which we can see are neatly arranged into three columns as well as an index column. Be aware that Python starts indexes at 0 and not 1, such that if you wanted to call up the first value in a dataframe, you’d use 0 instead of 1! You can change the number of rows displayed by adding a number of your choice within the parentheses. Try it out!

RENAMING COLUMNS

One thing you’ll quickly realize in Python is that names with certain special characters (such as $) can become very annoying to handle. We’ll want to rename certain columns, something you can do easily in Excel by clicking on the column name and typing over the old name and something you can do in SQL either with the ALTER TABLE statement or sp_rename in SQL server.

In Pandas, the way to do it is with the rename function.

gdp = gdp.rename(columns = {'US$':'gdp_per_capita'}) 

In implementing the above function, we’ll be replacing the column header ‘US$’ with the column header ‘gdp_per_capita’. A quick .head() function call confirms that this change has been made.

DELETING COLUMNS

There’s been some data corruption! If you look at the Rank column, you’ll notice that there are random dashes scattered throughout it. That’s not good, and since the actual number order is disrupted, this makes the Rank column quite useless, especially with the numbered index column that Pandas gives you by default.

Fortunately, deleting a column is easy with a built-in Python function: del. By selecting columns through the use of square brackets appended to the dataframe name.

del gdp['Rank']

Now, with another call to the head function, we can confirm that the dataframe no longer contains a rank column.

CONVERTING DATA TYPES WITHIN COLUMNS

Sometimes, a given data type is hard to work with.This handy tutorial will break down the differences between the different data types in Python in case you need a refresher.

In Excel, you could right-click and find ways of converting columns of data to a different type of data quite easily. You could copy a set of cells rendered by formulas and paste special as values, and you can use formatting options to quickly switch between numbers, dates, and strings. 

It’s not as easy in Python to switch between one data type to the other sometimes, but it’s certainly possible.

Let’s first use the re library in Python. We will regular expressions to replace the commas within the gdp_per_capita column so we can more easily work with that column.

gdp['gdp_per_capita'] = gdp['gdp_per_capita'].apply(lambda x: re.sub(',','',x))

The re.sub function essentially takes every comma and replaces it with a blank space. This following tutorial goes into each function of the re library in detail.

Now that we’ve gotten rid of the commas, we can easily convert the column into a numeric one.

gdp['gdp_per_capita'] = gdp['gdp_per_capita'].apply(pd.to_numeric)

Now we can calculate a mean for the column.

We can see that the mean of the GDP per capita column is about $13037.27, something we couldn’t do if the column were classified as strings (which you can’t perform arithmetic operations on). We can now do all sorts of calculations on the GDP per capita column that we weren’t able to do before — including filtering the columns by different values and determining what percentile rank values are for the column.   

SELECTING/FILTERING DATA

The basic need of any data analyst is to slice and dice a large dataset into actionable insights. In order to do that, you have to go through a subset of the data you have: this is where selecting and filtering data is very helpful. In SQL, this is accomplished with a mix of SELECT and different other functions, while in Excel, this can be done by dragging and dropping through data and implementing filters.

Using the Pandas library, you can quickly filter down with different functions or queries.

Let’s, as a quick proxy, only show countries that have a GDP per capita above $50,000.

This is how to do it:

gdp50000 = gdp[gdp['gdp_per_capita'] > 50000]

We assign a new dataframe with a filter that takes a column and creates a boolean variable — this function above essentially says “create a new dataframe for which there is a GDP per capita above 50000”. Now we can display gdp50000.

And now we see that there are 12 countries with a GDP above 50000!

Now let’s select only rows that belong to a country that start with s.

We can now display a new dataframe containing only countries that start with s. A quick check with the len function (a life-saver for counting the number of rows in a dataframe!) indicates that we have 25 countries that fit the bill.

Now what if we want to chain those two filter conditions together?

Here’s where chained filtering comes in handy. You’ll want to understand how this works before filtering with multiple conditions. You’ll also want to understand the basic operators in Python. For the purposes of this exercise you just need to know that ‘&’ stands for AND — and that ‘ | ‘ stands for OR in Python. However, with a deeper understanding of all basic operators, you can easily manipulate data with all sorts of conditions. 

Let’s go ahead and work on filtering countries that both start with ‘S’ AND that have a GDP per capita above 50,000.

sand500gdp = gdp[(gdp.gdp_per_capita > 50000) & (gdp.Country.str.startswith('S'))]

Now let’s work on those that start with S OR have over 50000 GDP per capita.

sor500gdp = gdp[(gdp.gdp_per_capita > 50000) | (gdp.Country.str.startswith('S'))]

There we go! We’re well on our way to working with filtered views in Pandas.

MANIPULATE DATA WITH CALCULATIONS

What would Excel be without functions that help you calculate different results?

Pandas in this case leans heavily on the numpy library and general Python syntax to put calculations together. We’re going to go through a simple series of calculations on the GDP dataset we’ve been working on. Let’s for example, calculate the sum total of all GDP per capita countries that are over 50,000.

gdp50000.gdp_per_capita.sum()

That’ll give you the answer of 770046. Using that same logic we can calculate all sorts of things — the full list can be located at the Pandas documentation under the computation/descriptive statistics section located on the menu bar at the left.

DATA VISUALIZATION (CHARTS/GRAPHS)

Data visualization is a very powerful tool — it allows you to share insights you’ve gained with others in an accessible format. A picture, after all, is worth a thousand words. SQL and Excel both have the capability to translate queries into charts and graphs. With the seaborn and matplotlib libraries, you can do the same with Python.

There are far more comprehensive tutorials on data visualization options — a favorite of mine is this Github readme document (all in text) which explains how to build probability distributions and a wide variety of plots in Seaborn. That should give you an idea of how powerful data visualization can be in Python. If you’re ever feeling overwhelmed, you can use a solution such as Plot.ly which might be more intuitive to grasp.

We’re not going to go through each and every data visualization option — suffice it to say that with Python, you’re going to have a lot more power to visualize things than anything SQL can offer, and you’ll have to trade-off the additional flexibility you gain with Python for how easy it is in Excel for generating charts from templates.

In this case, we’re going to build a simple histogram to show the distribution of GDP per capita for those countries that have more than $50,000 in GDP per capita.

gdp50000.hist() 

With this powerful histogram function (hist()) we can now generate a histogram that shows that most of the countries with a high GDP per capita cluster around the $50000 to $70000 range!

GROUPING AND JOINING DATA TOGETHER

Within Excel and SQL, powerful tools such as the JOIN function and pivot tables allow for the rapid aggregation of data.

Pandas and Python share many of the same functions that have been ported over from both SQL and Excel. You’ll be able to group data within datasets and join different datasets together. You can take a look here at the documentation. You’ll find that the join functionality offered by the merge function in Pandas is very similar to the one offered by SQL through the join command, while Pandas also offers pivot table functionality for those who are used to it in Excel.

We’re going to do a simple join here between the table we’ve developed with GDP per capita, and a list of world development indices from the World Bank.

Let’s first import the csv of country-level indicators.

country = pd.read_csv("Country.csv")

Let’s do a quick .head() function to take a look at the different columns in this dataset.

Now that we’re done, we can take a quick look and see that we’ve added a few columns that we can play with, including different years where data was sourced.

Now let’s merge the data:

gdpfinal = pd.merge(gdp,country, how = 'inner', left_on='Country', right_on = 'TableName')

We can now see the table incorporates elements of both our GDP per capita column and our new country-wide table with different data columns. For those familiar with SQL joins, you can see that we’re doing an inner join on the Country column of our original dataframe. 

Now that we have a joined table, we may want to group countries and their GDP per capita by the region of the world they’re in.

We can now use the group by functions in Pandas to play around with the data grouped by region.

gdpregion = gdpfinal.groupby(['Region']).mean()

What if we want to see a permanent view of groupby summation? Groupby operations create a temporary object that can be manipulated, but they don’t create a permanent interface to aggregated results that can be built upon. For that, we’ll have to go through an old favorite of Excel users: the pivot table. Fortunately, pandas has a robust pivot table function.

gdppivot = gdpfinal.pivot_table(index=['Region'], margins=True, aggfunc=np.mean)

gdppivot

You’ll see we’ve picked up some extra columns we don’t need. Fortunately, with the drop function in Pandas, you can easily delete several columns.

gdppivot.drop(['LatestIndustrialData', 'LatestTradeData', 'LatestWaterWithdrawalData'], axis=1, inplace=True)

gdppivot

Now we can see that the GDP per capita differs depending on the regions in different parts of the world. We have a clean table with the data we want.

This is a very superficial analysis: you’d want to actually do a weighted mean since a GDP per capita for each nation is not representative of the GDP per capita of every nation in a group since populations differ across the nations within a group.

In fact, you’ll want to redo all of our calculations involving means to reflect a population column for each country! See if you can do that within the Python notebook you’ve just started. If you can figure it out, you’ll have been well on your way to transferring your SQL or Excel knowledge to Python. 

Got any comments or questions? Please leave them in the comments section on this blog post 🙂 

Data Science/Artificial Intelligence, Learning Guides

Python List Comprehension: An Intro and 5 Learning Tips

Python list comprehension: an introduction and 5 great tips to learn

Python list comprehension empowers you to do something productive with code. This applies even if you’re a total code newbie. At code(love), we’re all about teaching you how to code and embrace the future, but you should never use technology just for its own sake.

Python list comprehension allows you to do something useful with code by filtering out certain values you don’t need in your data and changing lists of data to other lists that fit specifications you design. Python list comprehension can be very useful and it has many real-world applications: it is technology that can add value to your work and your day-to-day.

To start off, let’s talk a bit more about Python lists. A Python list is an organized collection of data. It’s perhaps easiest to think of programming as, among other things, the manipulation of data with certain rules. Lists simply arrange your data so that you can access them in an ordered fashion.

Let’s create a simple list of numbers in Python.

numbers = [5,34,324,123,54,5,3,12,123,657,43,23]
print (numbers)
[5, 34, 324, 123, 54, 5, 3, 12, 123, 657, 43, 23]

You can see that we have all of the values we put into the variable numbers neatly arranged and accessible at any time. In fact, we can access say, the fifth variable in this list (54) at any time with Python list notation, or we can access the first 5 and last 5 values in the list.

print(numbers[:5]); print(numbers[-5:]); print(numbers[4])
[5, 34, 324, 123, 54]
[12, 123, 657, 43, 23]
54

If you want to learn more about how to work with Python lists, here is the official Python documentation and an interactive tutorial from Learn Python to help you play with Python lists.

Python list comprehensions are a way to condense Python for loops into lists so that you apply a formula to each value in the old list to create a new one. In other words, you loop a formula or a set of formulae to create a new list from an old one.

What can Python list comprehensions do for you?

Here’s a simple example where we filter out exactly which values in our numbers list are below 100. We start by applying the [ bracket, then add the formula we want to apply (x < 100) and the values we want to apply it to for (x in numbers -> numbers being the list we just defined). Then we close with a final ] bracket.

lessthan100 = [x < 100 for x in numbers]
print (lessthan100)
[True, True, False, False, True, True, True, True, False, False, True, True]
#added for comparision purposes
[5, 34, 324, 123, 54, 5, 3, 12, 123, 657, 43, 23]

See how everything above 100 now gives you the value FALSE?

Now we can only display which values are below 100 in our list and filter out the rest with an if filter implemented in the next, which is followed by the if trigger.

lessthan100values = [x for x in numbers if x < 100]
print(lessthan100values)
[5, 34, 54, 5, 3, 12, 43, 23]

We can do all sorts of things with a list of numbers with Python list comprehension.

We can add 2 to every value in the numbers list with Python list comprehension.

plus2 = [x + 2 for x in numbers]
print (plus2)
[7, 36, 326, 125, 56, 7, 5, 14, 125, 659, 45, 25]

We can multiply every value by 2 in the numbers list with Python list comprehension.

multiply2 = [x * 2 for x in numbers]
print(multiply2)
[10, 68, 648, 246, 108, 10, 6, 24, 246, 1314, 86, 46]

And this isn’t just restricted to numbers: we can play with all kinds of data types such as strings of words as well. Let’s say we wanted to create a list of capitalized words in a string for the sentence “I love programming.”

codelove = "i love programming".split()
codelovecaps = [x.upper() for x in codelove]
print(codelove); print(codelovecaps)
['i', 'love', 'programming']
['I', 'LOVE', 'PROGRAMMING']

Hopefully by now, you can grasp the power of Python list comprehension and how useful it can be. Here are 5 tips to get you started on learning and playing with data with Python list comprehensions. 

1) Have the right Python environment set up for quick iteration

When you’re playing with Python data and building a Python list comprehension, it can be hard to see what’s going on with the standard Python interpreter. I recommend checking out iPython Notebook: all of the examples in this post are written in it. This allows you to quickly print out and change list comprehensions on the fly. You can check out more tips on how to get the right Python setup with my list of 11 great resources to learn and work in Python.

2) Understand how Python data structures work

In order for you to really work with Python list comprehensions, you should understand how data structures work in Python. In other words, you should know how to play with your data before you do anything with it. The official documentation on the Python website for how you can work with data in Python is here. You can also refer again to our resources on Python.

3) Have real-world data to play with

I cannot stress enough that while a Python list comprehension is useful even with pretend examples, you’ll never really understand how to work with them and get things done until you have a real-world problem that requires list comprehensions to solve.

Many of you came to this post with something you thought list comprehensions could solve: that doesn’t apply to you. If you’re one of those people who are looking to get ahead and learn without a pressing problem, do look at public datasets filled with interesting data. There’s even a subreddit filled with them!

Python list comprehension with code(love)

Real-world data with code(love)

4) Understand how to use conditionals in list comprehensions

One of the most powerful applications of Python list comprehensions is the ability to be able to selectively apply different treatments to different values in a list of values. We saw some of that power in some of our first examples.

If you can use conditionals properly, you can filter out values from a list of data and selectively apply formulas of any kind to different values.

The logic for this real-life example comes to us from this blog post and Springboard’s Data Science Career Track.

Imagine you wanted to find every even power of 2 from 1 to 20.

In mathematical notation, this would look like the following:

A = {x² : x in {0 … 20}}

B = {x | x in A and x even}

square20 = [x ** 2 for x in range(21)]
print(square20)
[0, 1, 4, 9, 16, 25, 36, 49, 64, 81, 100, 121, 144, 169, 196, 225, 256, 289, 324, 361, 400]
evensquare20 = [x for x in square20 if x % 2 == 0]
print (evensquare20)
[0, 4, 16, 36, 64, 100, 144, 196, 256, 324, 400]

In this example, we first find every square power of the range of numbers from 1 to 20 with a list comprehension.

Then we can filter which ones are even by adding in a conditional that only returns TRUE for values that when divided by 2 return a remainder of 0 (even numbers, in other words).

We can then combine the two into one list comprehension.

square20combined = [x ** 2 for x in range(21) if x % 2 == 0]
print(square20combined)
[0, 4, 16, 36, 64, 100, 144, 196, 256, 324, 400]

Sometimes, it’s better not to do this if you want things to be more readable for your future self and any audience you’d like to share your code with, but it can be more efficient.

5) Understand how to nest list comprehensions in list comprehensions and manipulate lists with different chained expressions

The power of list comprehensions doesn’t stop at one level. You can nest list comprehensions within list comprehensions to make sure you chain multiple treatments and formulae to data easily.

At this point, it’s important to understand just what list comprehensions do again. Because they’re condensed for loops for lists, you can think about how combining outer and inner for loops together. If you’re not familiar with Python for loops, please read the following tutorial.

This real-life example is inspired from the following Python blog.

list = [(x,y) for x in range(1,10) for y in range(0,x)]
print(list)
[(1, 0), (2, 0), (2, 1), (3, 0), (3, 1), (3, 2), (4, 0), (4, 1), (4, 2), (4, 3), (5, 0), (5, 1), (5, 2), (5, 3), (5, 4), (6, 0), (6, 1), (6, 2), (6, 3), (6, 4), (6, 5), (7, 0), (7, 1), (7, 2), (7, 3), (7, 4), (7, 5), (7, 6), (8, 0), (8, 1), (8, 2), (8, 3), (8, 4), (8, 5), (8, 6), (8, 7), (9, 0), (9, 1), (9, 2), (9, 3), (9, 4), (9, 5), (9, 6), (9, 7), (9, 8)]

If we were to represent this as a series of Python for loops instead, it might be easier to grasp the logic of a Python list comprehension. As we move from the outer loop to the inner loop, what happens is that for each x value from 1 to 9 (for x in range(1,10)), we print out a range of values from 0 to x.

for x in range(1,10):
    for y in range(0,x):
        print(x,y)
1 0
2 0
2 1
3 0
3 1
3 2
4 0
4 1
4 2
4 3
5 0
5 1
5 2
5 3
5 4
6 0
6 1
6 2
6 3
6 4
6 5
7 0
7 1
7 2
7 3
7 4
7 5
7 6
8 0
8 1
8 2
8 3
8 4
8 5
8 6
8 7
9 0
9 1
9 2
9 3
9 4
9 5
9 6
9 7
9 8

The chain of for loops we just went over has the exact same logic as our initial list comprehension. You’ll notice though that in a for loop, you will print seperate values while in a list comprehension it will produce a new list, which allows us to use Python list notation to play with the data.

With this in mind, you can make your code more efficient and easily manipulable with a Python list comprehension.

I hope you enjoyed my introduction to Python List Comprehensions. If you want to check out more content on learning code, check out the rest of my content at code-love.com! Please comment if you want to join the discussion, and share if this created value for you 🙂

Learning Guides

How I grew my mailing list by 133 emails in 2 hours

I’ve always had a theory that Newton’s Third Law applied to people. I think that’s largely been borne out by all that I’ve experienced.

Put your trust in people and you’ll get that trust repaid in you.

Do good, and others will do good unto you.

It was Dale Carnegie’s How to Win Friends and Influence People that probably put it best—when you make people feel like they’re important, they’ll respond to you in kind. You shouldn’t ask people for things directly: you should ask them for a favor, make sure that they know that they’re in a position of influence and power. That will elicit a favorable response to your endeavors.

I’ve always been a huge fan of involving people in creative projects, getting people to feel like they have ownership over something even if it wasn’t them that originated the idea. I think that’s the basis of the greatest way to grow something: when people push your idea as if it was their own. Then, if you can get them to join up with you for the long haul by joining your mailing list, you’ll be able to grow your own brand as well.

If people believe that you’ve heeded their words, and that they’ve played a part in your creative process, people will act on your behalf. If you genuinely listen to the input people give you, that’ll make them feel even more inclined to help spread the word.

I’ve always loved testing this—collecting both information that shapes my creative projects, and fans is a strong ideal for me. I worked for a startup where I segmented all of their top users, and surveyed them about what they actually used it for. Those super-users not only gave a ton of insight—they re-activated and used the product again at higher rates.

So while I was preparing for the launch of my book, I wondered how I could get people involved. Finally, it hit me: I was missing the most important element of my book: the title.

So I set off to create a survey form and prepare a list of startup Facebook groups I wanted to ask for their insights. Here’s what the form looked like:

Entrepreneur Blackjack Google Form with code(love)

I collected the answers on a Google spreadsheet connected to the form. Technologically, it took me about 5 minutes to get this all set up.

I then spent a couple of hours sending the link to this form on my personal social media profiles, and on a few selected startup Facebook groups. The results were convincing—

I got 369 clicks. Out of those 369, 167 replied with a title (conversion rate of 45.25%), and 133 asked to be part of the mailing list for when the book launched (conversion rate of 36%).

The click-through rate on the first newsletter I sent out was 20%, leading me to believe that upwards of about 30 people got wind of my book from just a couple of hours of work. I did get a few unsubscribes, but many people opted to stay on my mailing list: so I added a pool of new subscribers interested in what I do. I was able to grow my mailing list very rapidly.

I got great data from the 167 responses.

A significant amount of people chose the other option, which meant my titles I thought up were not strong enough. In a comment on one of the Facebook threads, someone came up with the idea that I should title the book Startup Blackjack since I was defining 21 startup terms—I ended up titling the book Entrepreneur Blackjack: 21 Startup Buzzwords Defined. This was also because titles with the word “Defined” scored high in the chosen categories—and so did the word bulls**t, even if I didn’t incorporate that (it might be something where profanity does drive sales, but I was giving my parents the book, so it wasn’t the best choice for me.)

Why did this happen?

I believe it’s because I really tapped into the entrepreneurs I asked ,making them feel part of the creative process. With two simple call-to-action prompts, people could contribute their input, then buy into the project they just helped create. For me it was a win-win-win—I got more people interested in the book, people who wanted the information I collected got access, and I created the title of the book with customer validation rather than blind guessing. I was able to grow my mailing list with new fans who were engaged straight off the bat.

With every action, there’s an equal reaction. I believed in creating with others—and I was happy to see others wanted to create with me. Here’s to your efforts to activating that same feeling.

Comment below if you’ve ever done something like this, or are giving this a try. I want to learn with you. 

Want to learn more?  Check out our other learning guides, and our learning lists filled with free resources to learn technology and entrepreneurship!

Learning Guides

How to learn Ruby

In an online chat session between Yukihiro Matsumoto and Keiju Ishitsuka in early 1993, a discussion ensued about the name of a programming language that Matsumoto was going to write. He wanted to satisfy his desire to have an object-oriented scripting language, something that would craft virtual objects composed of data, and help them interact with one another. The alternatives at the time, Python and Perl didn’t appeal to him, Python being too object-oriented and Perl having “the smell of a toy language”. Between “Coral” and “Ruby”, Matsumoto decided to go with the latter because it was the birthstone of one of his colleagues.

You have probably heard about Ruby, and you might be wondering—what is all the fuss?

For starters, it’s written in a very easy-to-use, intuitive manner.

For beginners who have tried teaching themselves a programming language, there are many obvious barriers like the syntax and semantics of a language. Ruby strives to eliminate some of those barriers, for example, by naming functions in a very “natural-language” like format, the is_a? function does exactly what it promises, returning a Boolean (TRUE or FALSE) telling you whether a given object is of a certain type. The question mark at the end of the function is a Ruby idiosyncrasy that hints that the function always returns a Boolean. It may seem odd in the beginning, but as the amount of Ruby you read increases, the more natural this process will become.

Ruby is widely deployed ranging from applications in simulations, 3D modeling, business, robotics to web applications and security. For example, Basecamp – a project management application is programmed entirely in Ruby. Google SketchUp, a 3D modeling tool uses Ruby as its macro scripting API—programmers can add in scripts of their own to the SketchUp program, helping them do things such as automating routine modelling processes, similar to how macros work in Excel.

So how might you go about to learn Ruby, now that you are convinced that it is valued by the software community?

Learn ruby with code(love)

Learn ruby with code(love)


Though the usual suspects like Codecademy and Learn Ruby the Hard Way are good resources to learn Ruby, there are a bunch of other resources including Try Ruby, Ruby Koans, Ruby Warriors and many more. The one that really stands out as a gem (incidentally also the name of self-contained libraries in Ruby) is RubyMonk.

RubyMonk follows a narrative style of teaching Ruby along with some programming basics. The premise is based on you having a “master” who gives you much needed encouragement if you go wrong and also gives you triumphant messages when you succeed at some of the exercises. RubyMonk draws from movies, and video games to keep you plugging away to learn Ruby.

What really makes it stand apart from other resources is the way the entire learning environment is structured. Each page in the chapter has some introduction, a new concept, an exercise to try out, some more concepts with exercises and wrapping it up by using all the elements learned in that chapter in a slightly challenging exercise. There are several levels – Ruby Primer, Ruby Primer: Ascent, Metaprogramming Ruby and Metaprogramming Ruby: Ascent.

Each of the levels deliver content indicative of their name and each chapter is sprinkled with practical exercises.The design of the exercises and their placement is what makes the learning experience on this website fun and engaging. The exercises are just a little beyond the skill level you acquired in the lesson and require a little bit of thinking and are perfect for people who are just beginning to learn programming. They help easily transfer the theory you learned into practice.

Once, you’re done going through all of their material, you can be fairly confident that even if you can’t change the world with Ruby, you’ll at least have enough knowledge to create fun programs and venture into some complex ones with little additional effort.

Yet another reason to learn: Ruby serves as a wonderful background to migrate to the popular Ruby on Rails web framework, which makes the learning curve for making web applications much easier.

Ruby on Rails was constructed with the explicit goal of making it as easy as possible to build an interactive web platform, and maintain it. It speaks to the Ruby philosophy of simple, intuitive building.

After you learn Ruby, you will be able to build your ideas rapidly, and efficiently. You will have learned a valuable skill that will help make building natural.

Not done learning? Visit the rest of our learning resources.